In the Excel object model, the Chart object represents a chart. A Chart object can be saved as a chart sheet in the Charts collection, or as a graphic type in the Shapes collection. In VBA, a Chart object can also be embedded in a worksheet and saved in the ChartObjects collection. Programmatically creating a chart means creating a Chart object and programming using its properties and methods along with related objects.
Creating Charts in Chart Sheets
In a chart sheet, the chart occupies the entire worksheet. Using Excel VBA and Python xlwings API, you can create a chart and display it in a chart sheet.
[Excel VBA] You can use the Add method of the Charts object to create a chart and display it in a new chart sheet. The syntax of the Add method is:
Set cht = wb.Charts.Add(Before, After, Count, Type)
Here, wb represents the specified workbook object. All parameters of the Add method are optional; their meanings are:
Before: Specifies a worksheet object; the new sheet will be inserted before this worksheet.
After: Specifies a worksheet object; the new sheet will be inserted after this worksheet.
Count: Number of sheets to add; default is 1.
Type: Specifies the chart type to add.
If both Before and After are omitted, the new chart sheet will be inserted before the active worksheet.
The Add method returns a Chart object.
Below, we use GDP data for several provinces from 2011–2016 (see Figure 6-1) to create a chart and display it in a chart sheet.
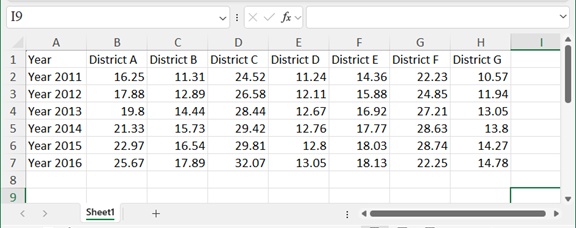
Figure 6-1
Sample file path: Samples\ch18\Excel VBA\Create chart sheet.xlsm.
Sub CreatCharts()
    Dim cht As Chart
    Set cht = Charts.Add    'Create chart in chart sheet
    With cht
        'Bind data
        .SetSourceData Source:=Sheets("Sheet1").Range("A1:H7"), PlotBy:=xlRows
        .ChartType = xlColumnClustered   'Chart type
        .HasTitle = True                'Has title
    End With
End Sub
Running the procedure generates the chart sheet shown in Figure 6-2.
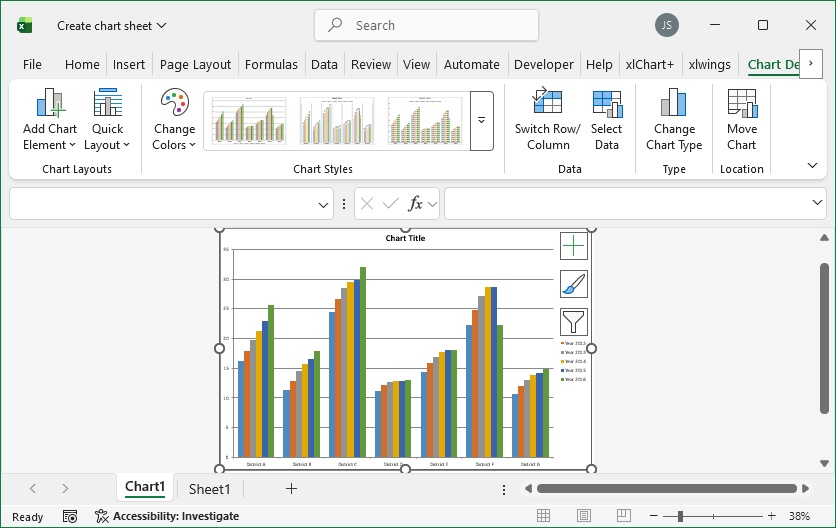
Figure 6-2
[Python xlwings API] In Python xlwings API mode, the created chart occupies the whole worksheet. You can add a new chart sheet to the Charts collection using the Add method. The syntax is:
wb.api.Charts.Add(Before, After, Count, Type)
Parameters are the same as in VBA.
Sample script path: Samples\ch18\Python\Creating Chart-xlwings API.py.
import xlwings as xw
import os
root = os.getcwd()
app = xw.App(visible=True, add_book=False)
wb = app.books.open(root + r'/GDP.xlsx', read_only=False)
sht = wb.sheets(1)
sht.api.Range('A1:H7').Select()
cht = wb.api.Charts.Add()
cht.ChartType = xw.constants.ChartType.xlColumnClustered
cht.HasTitle = True
Running the script generates the chart sheet shown in Figure 6-2.
Creating Embedded Charts
An embedded chart can be placed inside a normal worksheet, coexisting with data and other graphics. You can create embedded charts using the ChartObjects object in Excel VBA and with xlwings in Python.
[Excel VBA] Use the Add method of the ChartObjects object of a worksheet to create an embedded chart:
Set chtObj = sht.ChartObjects.Add(Left, Top, Width, Height)Parameters: Left, Top, Width, Height specify position and size. The method returns a ChartObject; you can further set the chart via its Chart property.
Sample file: Samples\ch18\Excel VBA\Create embedded chart.xlsm.
Sub CreateCharts()
    Dim cht As ChartObject
    Set cht = ActiveSheet.ChartObjects.Add(50, 200, 355, 211)
    With cht
        With .Chart
            .SetSourceData Source:=Sheets("Sheet1").Range("A1:H7"), PlotBy:=xlRows
            .ChartType = xlColumnClustered
            .SetElement msoElementChartTitleCenteredOverlay
        End With
    End With
End Sub
Running the procedure generates the embedded chart shown in Figure 6-3.
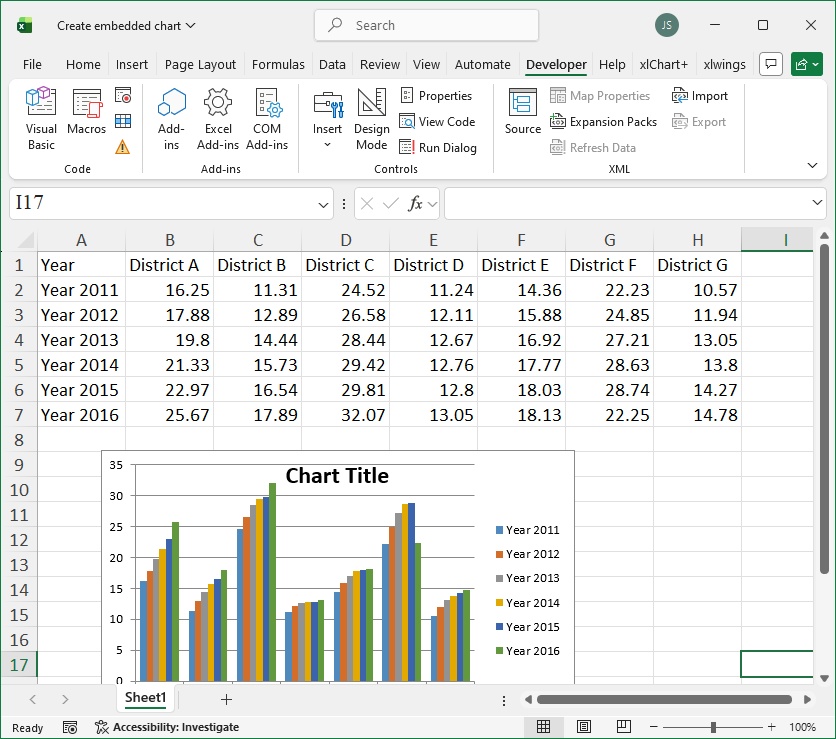
Figure 6-3
[Python xlwings] Use the add method of the charts object:
cht = sht.charts.add(left=50, top=200)
cht.set_source_data(sht.range('A1').expand())
cht.chart_type = 'column_clustered'
cht.api[1].HasTitle = True
Note: cht.api is a tuple containing a ChartObject and a Chart; indexing [1] accesses the Chart object for property setting.
Creating Charts Using the Shapes Object
You can also create charts using the Add method of the Shapes object. This creates a Shape object representing the chart; referencing its Chart property returns the Chart object.
[Excel VBA] Use AddChart2:
sht.Shapes.AddChart2(Style, xlChartType, Left, Top, Width, Height, NewLayout)Parameters are mostly optional; returns a Shape object.
Sample file: Samples\ch18\Excel VBA\Create chart using Shapes object.xlsm.
Sub CreateCharts()
    ActiveSheet.Range("A1").CurrentRegion.Select
    ActiveSheet.Shapes.AddChart2 -1, xlColumnClustered, 30, 150, 300, 200, True
End Sub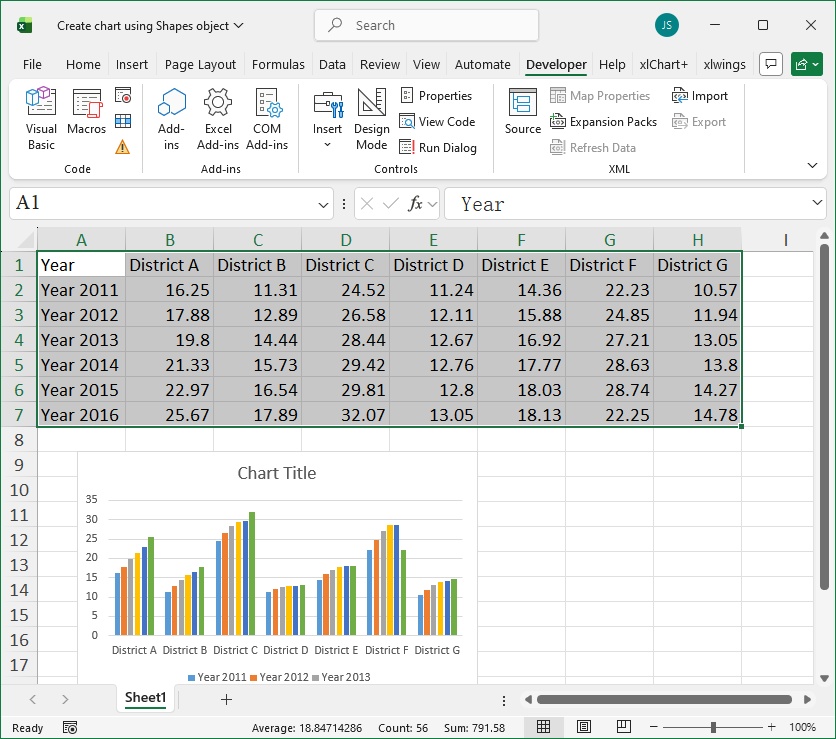
Figure 6-4
[Python xlwings API] Same method signature; example:
sht.api.Range('A1').CurrentRegion.Select()
sht.api.Shapes.AddChart2(-1, xw.constants.ChartType.xlColumnClustered, 30, 150, 300, 200, True)
Binding Data
Two main methods:
Select the data range:
VBA: sht.Range("A1").CurrentRegion.Select or sht.Range("A1:H7").Select
Python xlwings API: sht.api.Range('A1').CurrentRegion.Select()
SetSourceData / set_source_data:
VBA: cht.SetSourceData Source:=Range("A1:H7"), PlotBy:=1
Python xlwings: cht.set_source_data(sht.range('A1').expand())
Python xlwings API: cht.SetSourceData(Source=sht.api.Range('A1:H7'), PlotBy=1)